Futures statistics · 11+ years of data · Updated regularly
Know the odds
before you trade.
Not signals. Not predictions. Raw statistical probabilities from 12,000+ trading days — so you can build your edge on what actually happens.
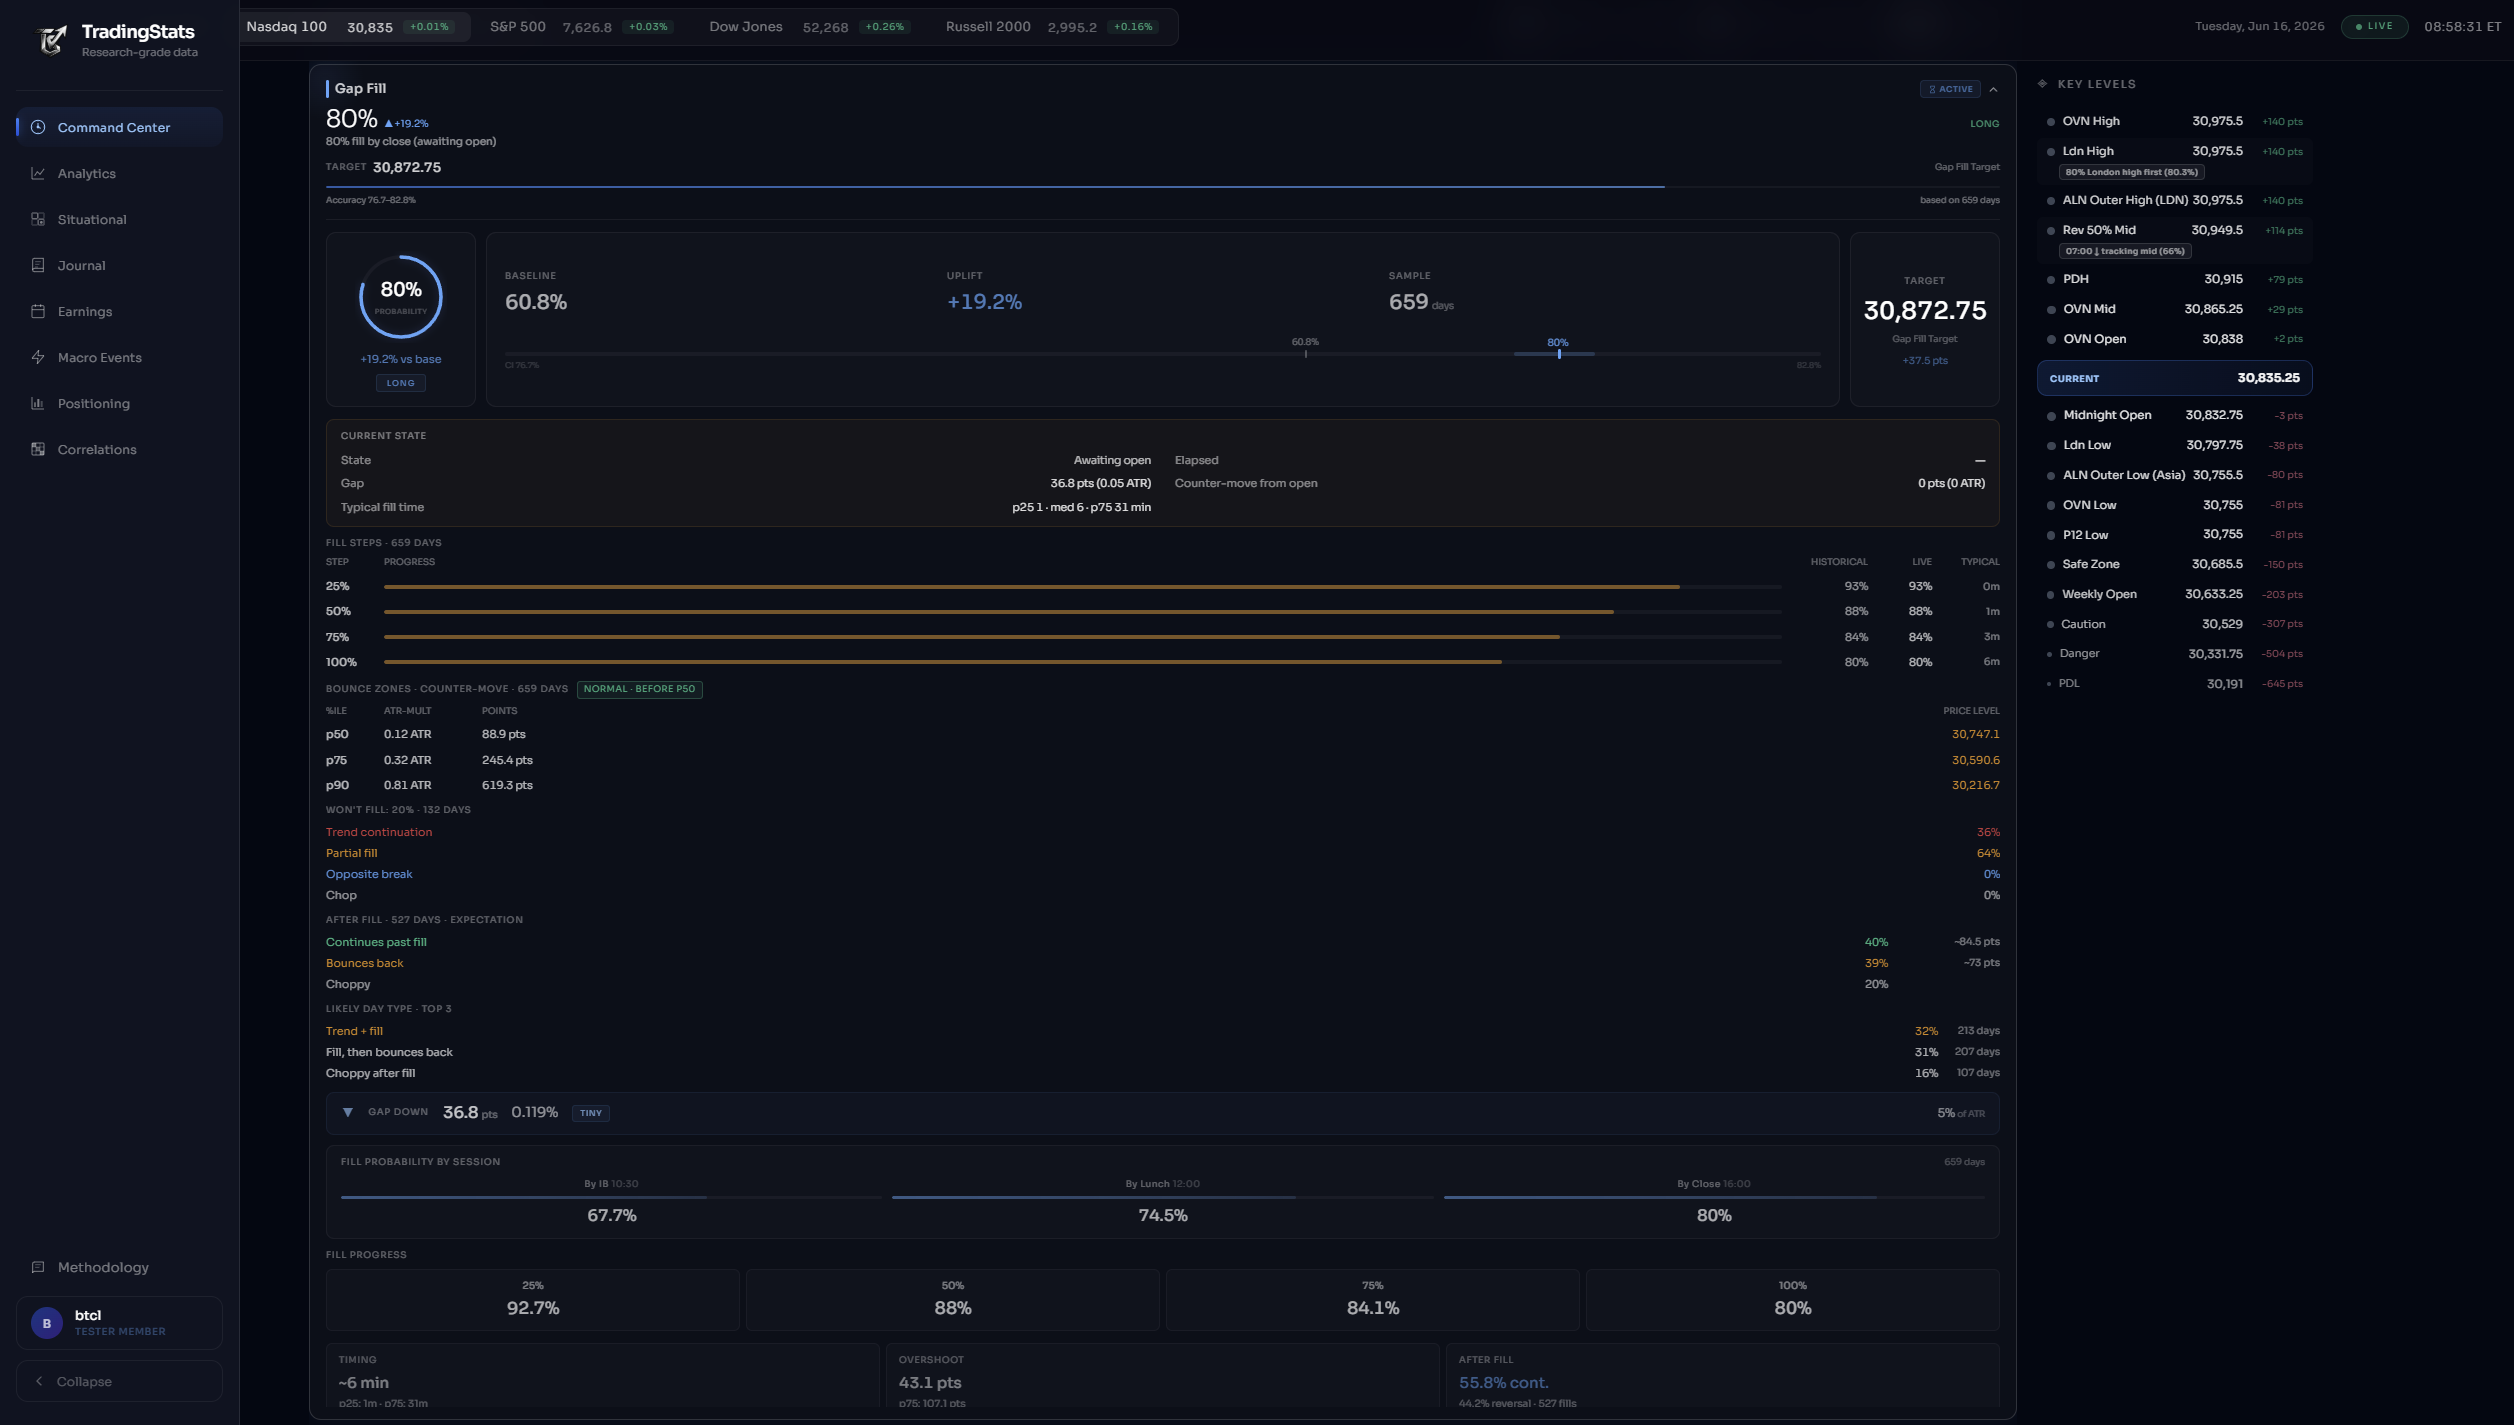
All 15 modules. One real-time view.
Command Center shows every active edge, every live probability, every key level — on one chart. No tab-switching, no spreadsheets, no signals.
Philosophy
We don’t tell you what to trade. We show you what the data says.
Signal services sell certainty that doesn’t exist. They give you a direction and a price — and you have no idea why.
TradingStats gives you conditional probabilities. A gap up on Tuesday in NQ has a 97% chance of testing yesterday’s high. That’s not a signal — that’s a measurable edge you can verify yourself.
Every number comes from the same clean, session-aware dataset. Fully transparent and reproducible methodology.
What signals give you
✕ “Buy NQ at 18,500” — no context, no reasoning
✕ Opaque methodology you can’t verify
✕ Relies on one person’s gut feeling
✕ Works until it doesn’t — no sample size
What TradingStats gives you
✓ “94% of days break the overnight range” — measured
✓ Open methodology, transparent calculations
✓ Built on 2,800+ days of real market behavior
✓ Filter by day, gap, session context — find your edge
+12,000
Trading days analyzed
+15
Interactive dashboards
12
Years of data
99.9%
Reproducible results
From raw data to actionable edge
Every probability comes from the same four-step pipeline. No black boxes, no guesswork.
Step 1
Detect market condition
Each module monitors a specific structure — overnight range, initial balance, session levels, gaps — and detects when a known pattern forms.
Step 2
Match against history
We filter 12 years of 1-minute data to find every historical occurrence of the same condition with matching filters and context.
Step 3
Calculate the probability
From hundreds or thousands of matching days, we compute exact probabilities for each outcome — direction, target, timing — with 95% confidence intervals.
Step 4
Update in real time
Probabilities aren’t static. They update every hour as price confirms or invalidates the expected move. The edge decays or strengthens throughout the session.
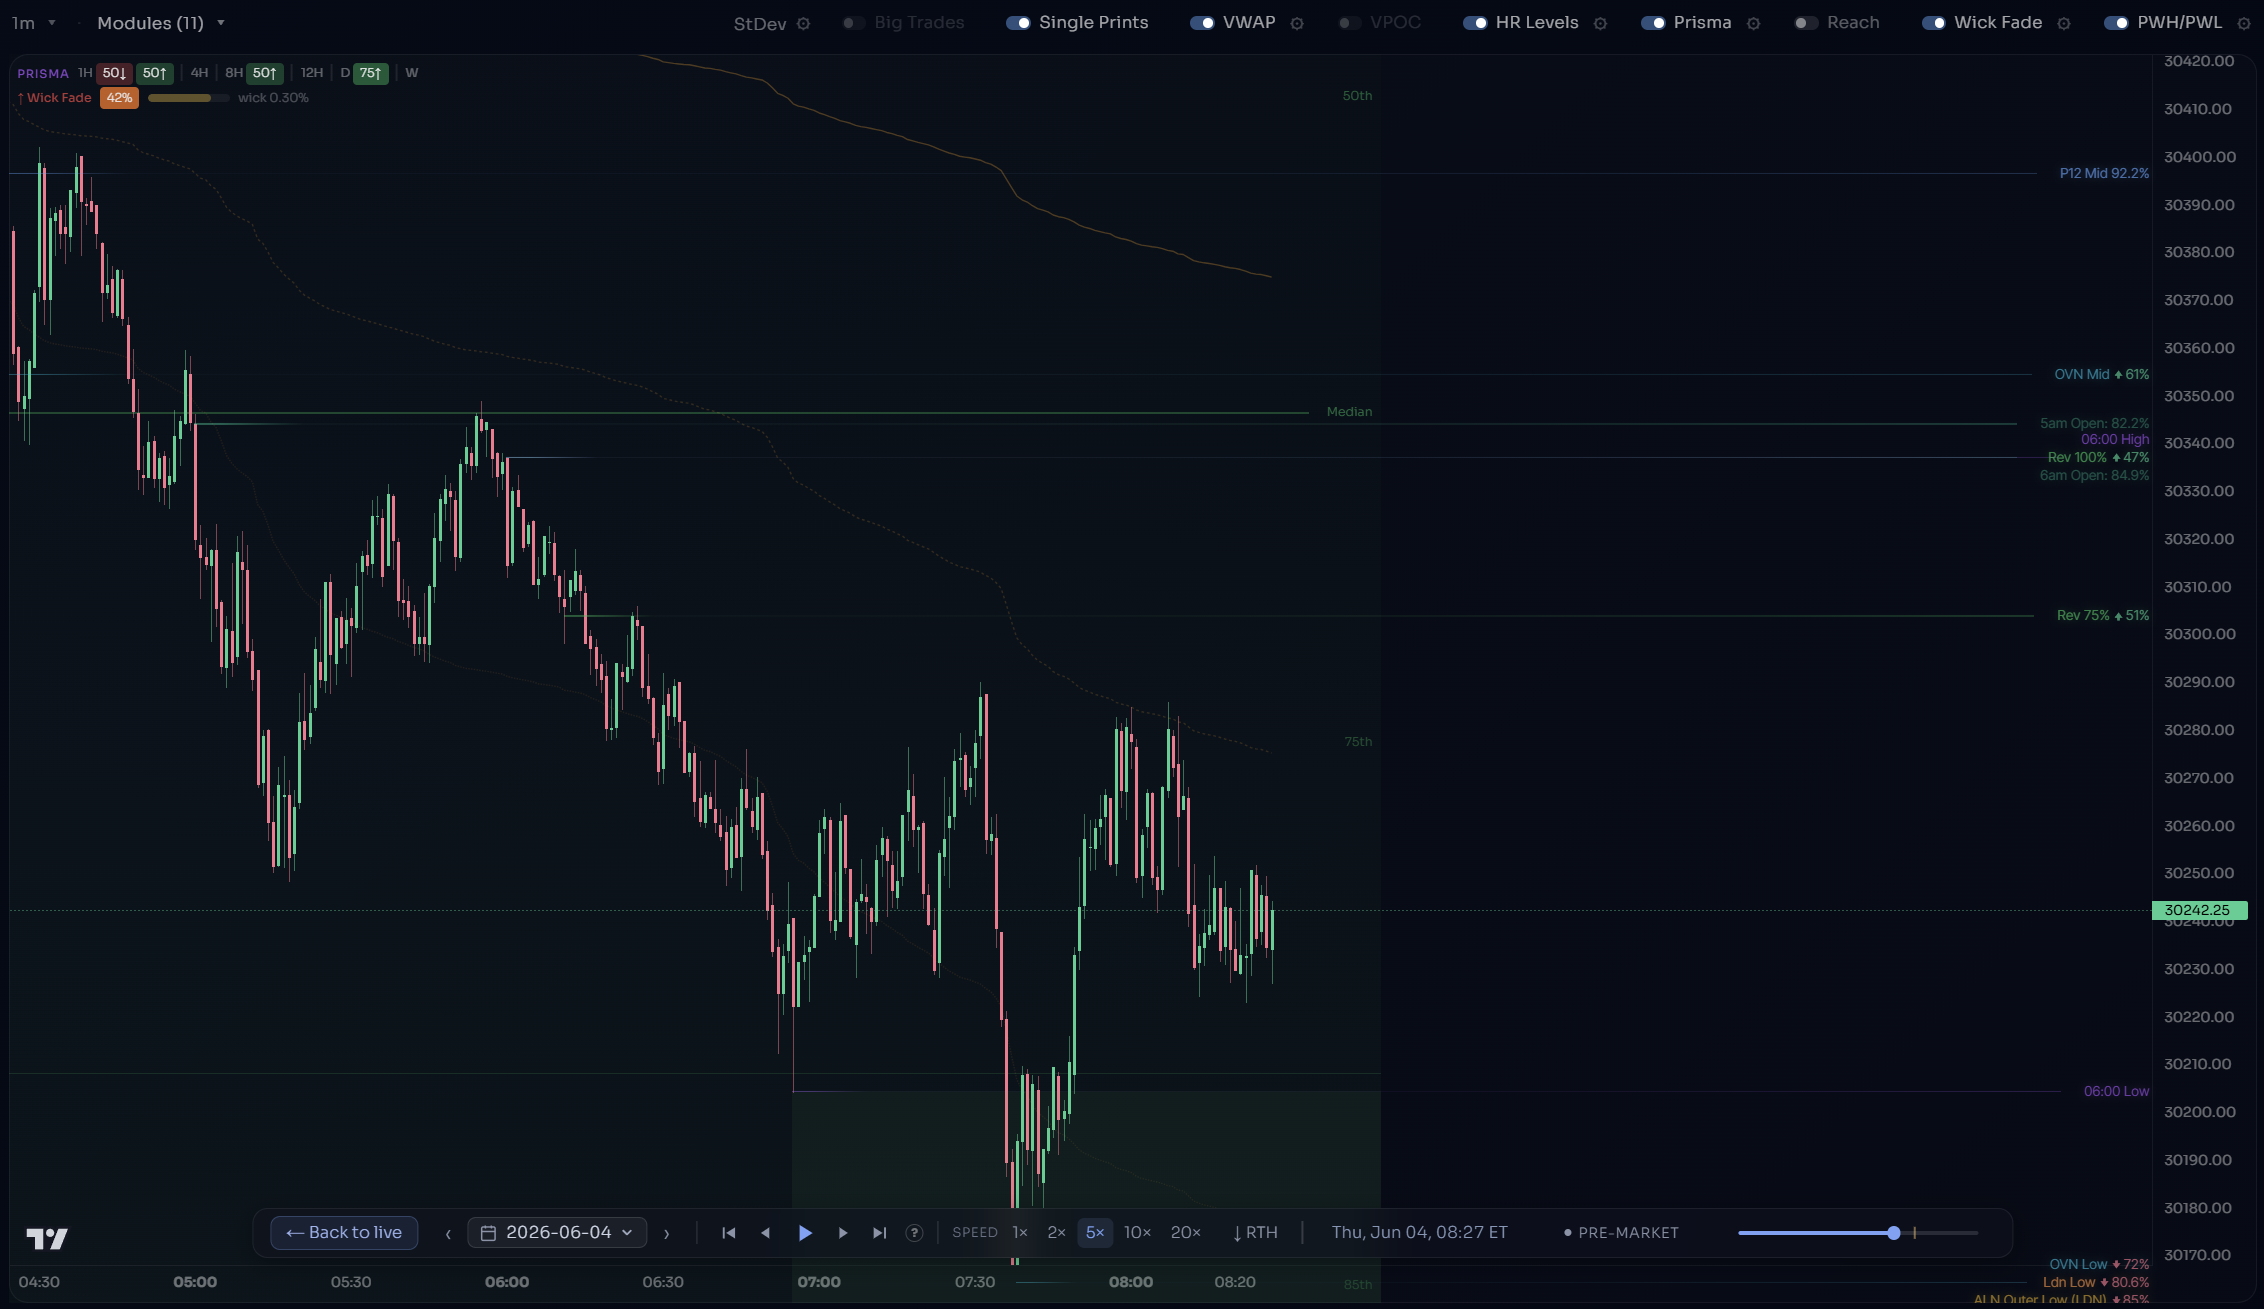
Every probability, plotted live on the chart
Every active edge appears as a labeled line. Overnight high breakout at 72%. IB extension target at 65%. Gap fill at 81%. All visible at a glance — no manual lookups, no switching tabs.
Dashboards
Every setup, measured
Three examples from 15+ interactive dashboards — each one built on real futures data.
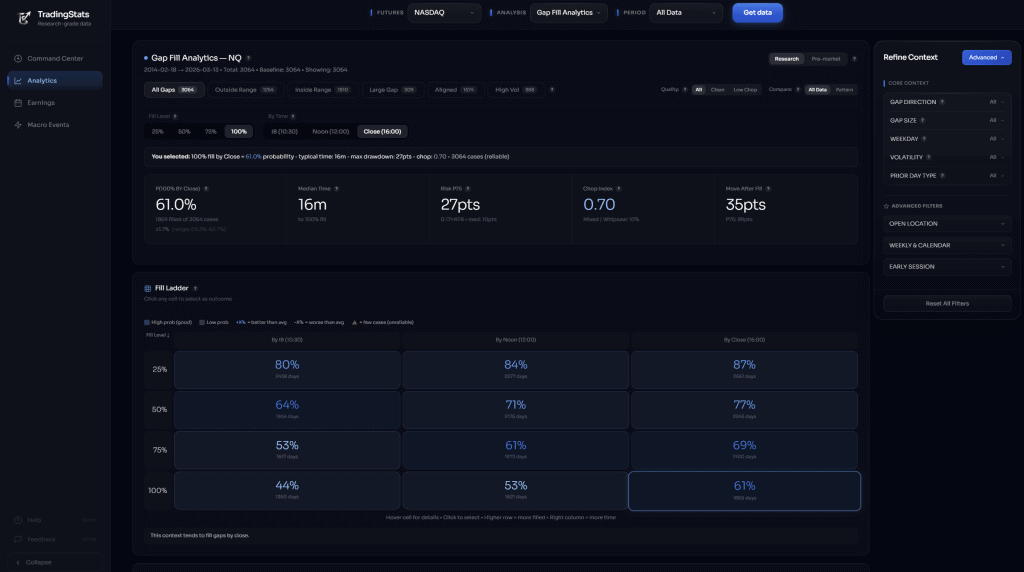
Gap Fill Analytics
Do gaps always get filled? Now you’ll know exactly when they do.
Fill rate by direction, gap size, weekday. Median time to fill. Partial vs full fills. Every gap since 2015, classified and measured.
✓ Gap size buckets
✓ Fill timing
✓ Weekday filter
✓ Direction bias
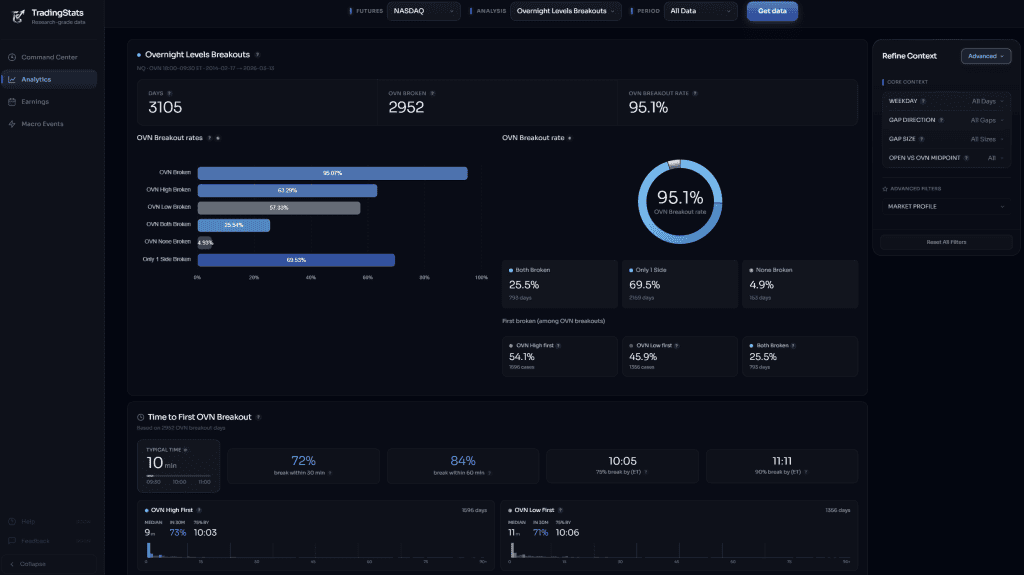
Overnight Range Breakout
Which overnight level breaks first — and can you predict it?
Where RTH opens relative to the overnight midpoint predicts direction with 76% accuracy. Filter by gap, weekday, and Market Profile context to stack conditions.
✓ Midpoint filter
✓ POC / VA
✓ Timing distribution
✓ Sweep risk
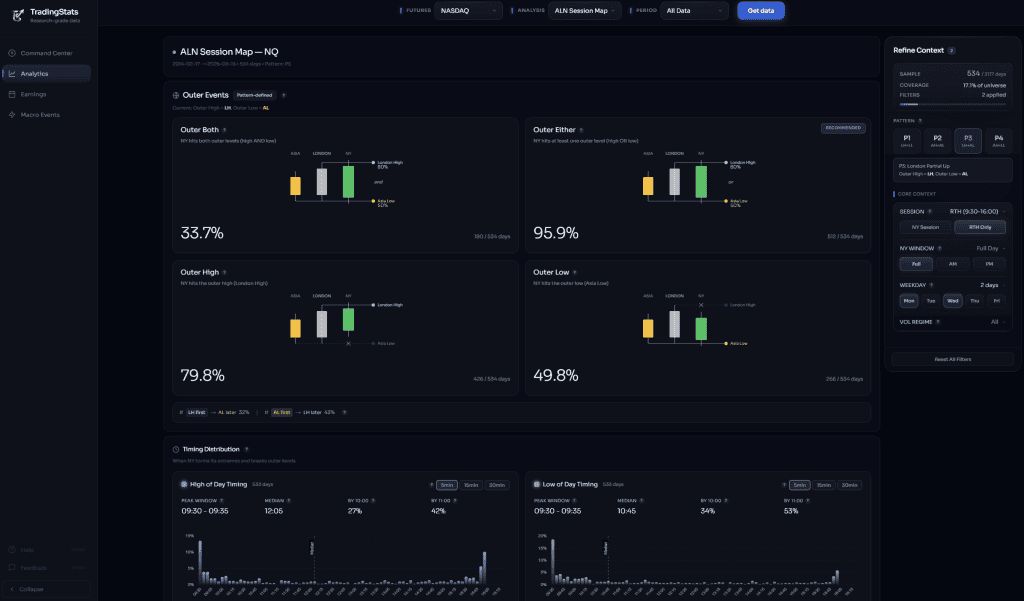
London Session Breakout
The 02:00–09:30 range creates four distinct patterns. All of them are measurable.
Bullish breakout, bearish breakout, sweep-and-reverse, fade — each pattern has its own frequency, timing profile, and Market Profile context. No guessing.
✓ Pattern classification
✓ Outer level targets
✓ Session map
✓ Context filters
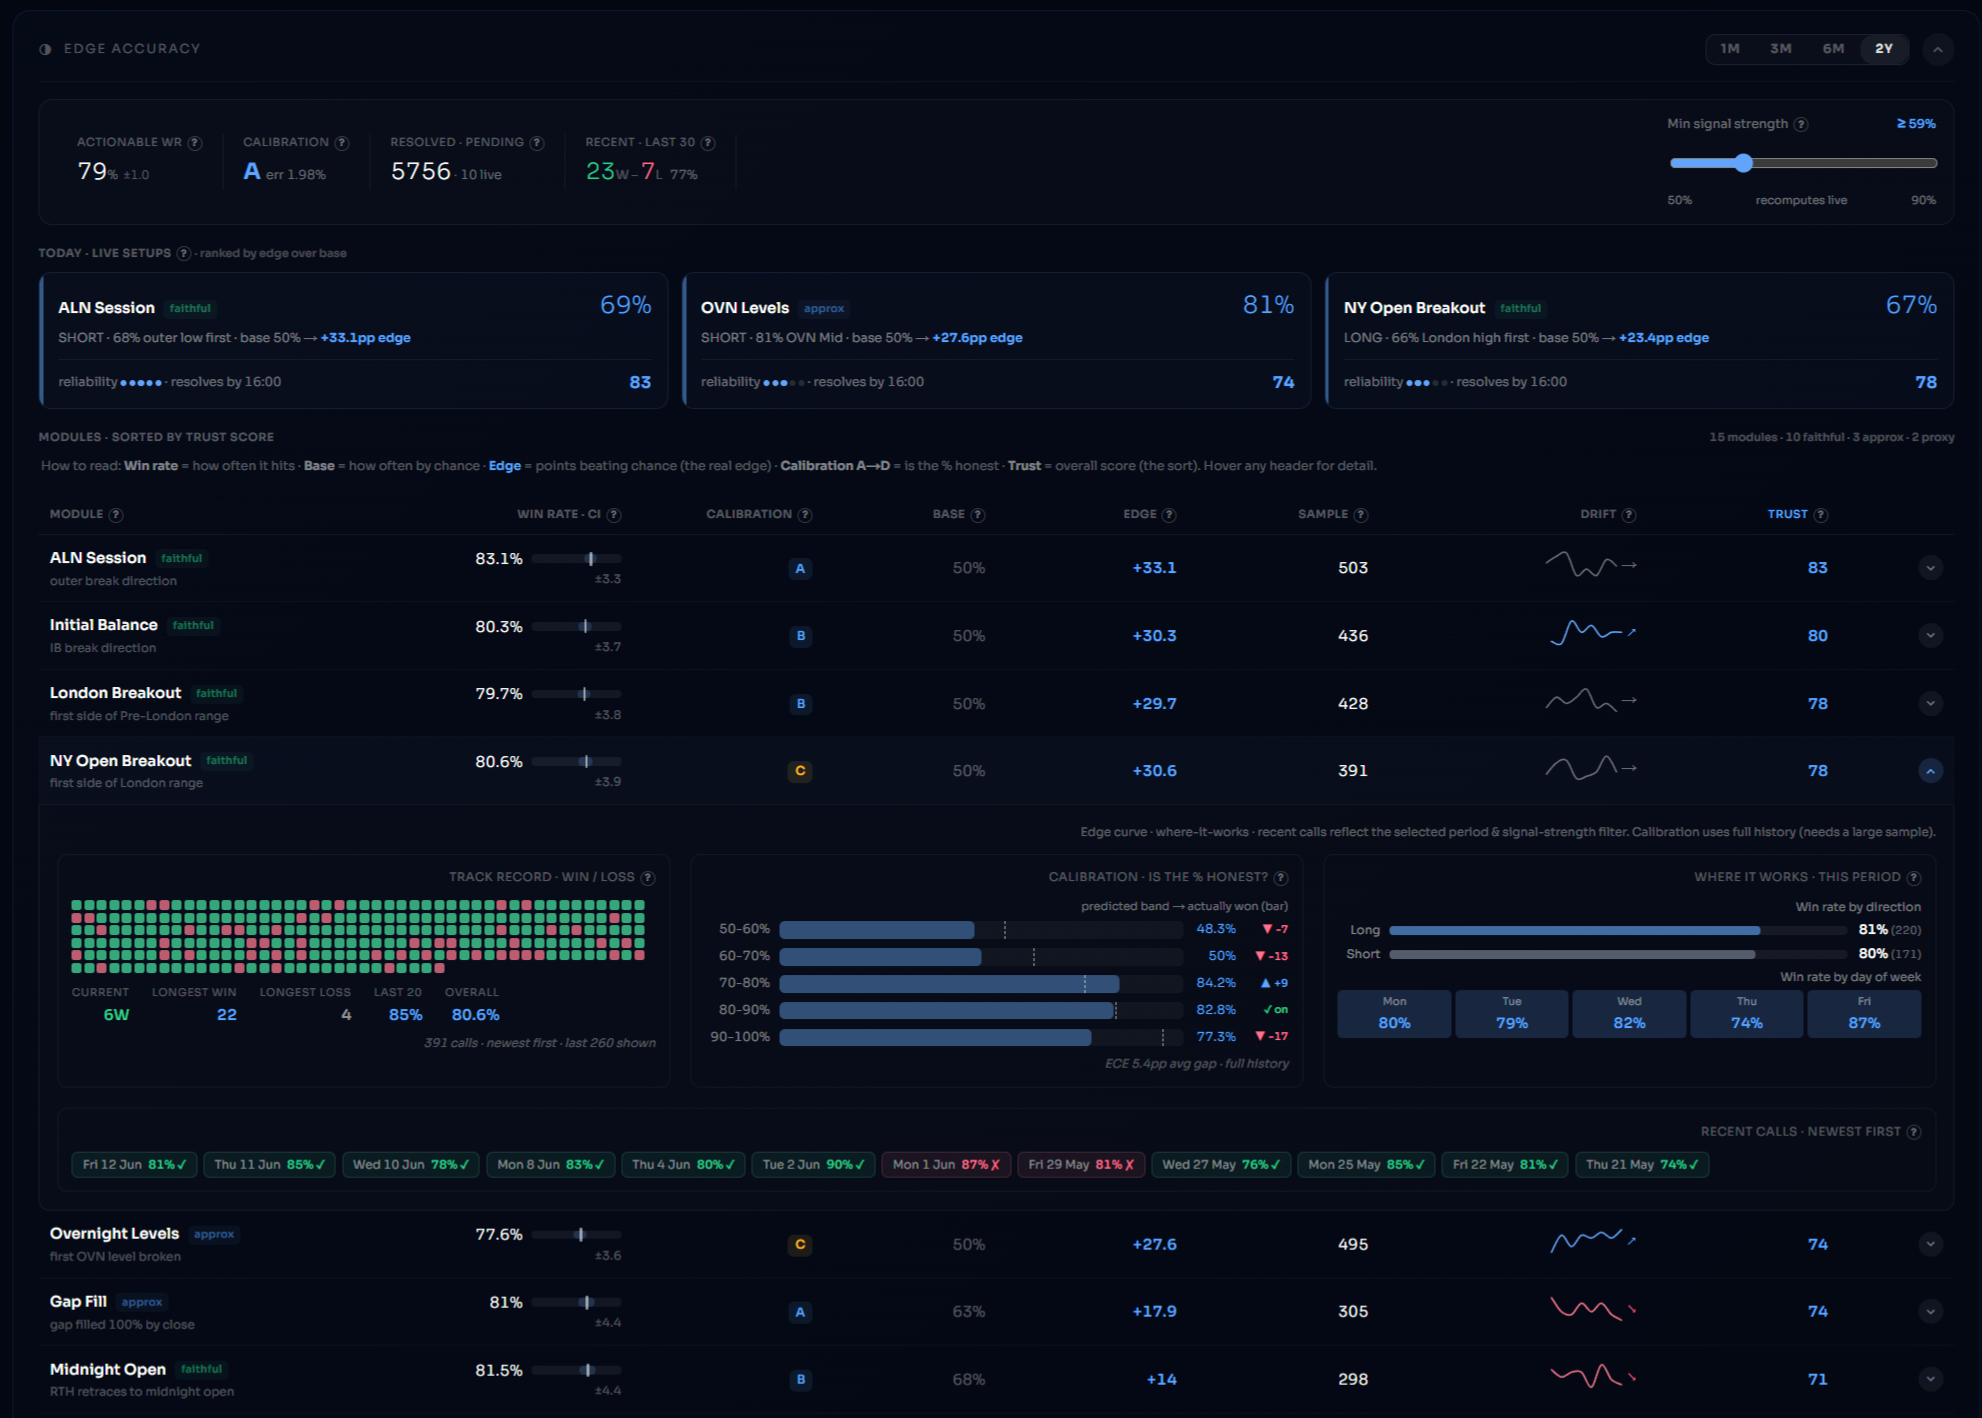
Don’t trust the edge. See its track record.
Every module is scored on its real history — win-rate vs base, points of edge over chance, and an A→D calibration grade that proves the % is honest. Sorted by a single Trust score, so you act on what actually fires.
Don’t just read the edge. Rewind it.
Step through any past session bar by bar. The chart and every module card read exactly as they did live that day — no hindsight, no repaint. Watch how a setup formed and what the edges said before the move, not after.
Every edge we track. In one terminal.
From the Asia session to the close — 15 backtested edges covering breakouts, levels, order flow and timing. Not one signal. A full map of the trading day.
Built different. On purpose.
This project started as a personal research tool — not a marketing funnel. Every number is one I needed to trust myself.
Session-aware data
RTH and ETH sessions are explicitly separated. No synthetic 24h bars, no ambiguous timestamps, daylight-saving handled correctly.
Fully reproducible
Every statistic in the app is calculated from a single consistent, session-aware methodology — same inputs, same numbers, every time.
No optimization, no curve-fitting
We don’t cherry-pick parameters that look good in hindsight. Every metric uses deterministic, rule-based logic across the full sample.
Built by a trader
This started as a tool I needed for my own research — designed to answer real questions, not to generate impressive-looking dashboards that don’t help.
Clean data. Transparent methodology. Fully reproducible results.
Clean, session-aware futures data is the foundation of every serious backtest.
TradingStats is built to eliminate session ambiguity, daylight saving time errors,
and hidden assumptions — so your research starts from solid, verifiable data.


Research
The data behind every claim
Deep-dive articles with full methodology. Every number verified.
Stop guessing.
Start measuring.
Every setup you trade has a probability attached to it. The only question is whether you know what it is — or whether you’re trading blind.
FAQ
What makes TradingStats data different from standard futures data?
TradingStats uses explicitly defined RTH and ETH trading sessions instead of generic 24-hour bars. This eliminates session ambiguity, timestamp drift, and artificial price behavior that often distorts backtest results.
How are RTH and ETH sessions defined?
RTH and ETH sessions are defined using fixed, exchange-accurate session boundaries. Sessions never overlap, never mix, and are applied consistently across all datasets and statistics.
How does TradingStats handle timezones and daylight saving time (DST)?
All timestamps follow explicit timezone rules with correct daylight saving adjustments. Weekly and daily levels never shift due to DST changes, ensuring stable and reproducible historical analysis.
Are the statistics calculated from reliable data?
Yes. Every statistic shown in the app is calculated using a consistent, session-aware methodology — no sampling, no approximations, and no separate calculation pipelines.
Is this data suitable for systematic and quantitative trading?
Absolutely. The data is specifically prepared for systematic strategies, quantitative research, and rule-based backtesting where consistency and reproducibility are critical.
Does TradingStats provide signals or trading recommendations?
No. TradingStats is a research and data platform. It does not provide signals, forecasts, or trading advice. All insights are derived from transparent, reproducible statistical analysis.
Can I reproduce the results shown on the website?
Yes. All results are fully reproducible using the documented session logic and methodology. There are no hidden filters, optimizations, or curve-fitting techniques.